I Load-Tested Kyu and the 'Optimization' I Added Was the Problem
Kyu is a job queue I've been building in Go. I always figured it'd hold up fine under real load, Postgres for durability, Redis for speed, dispatch itself basically free. Nice theory. Never actually tested it.
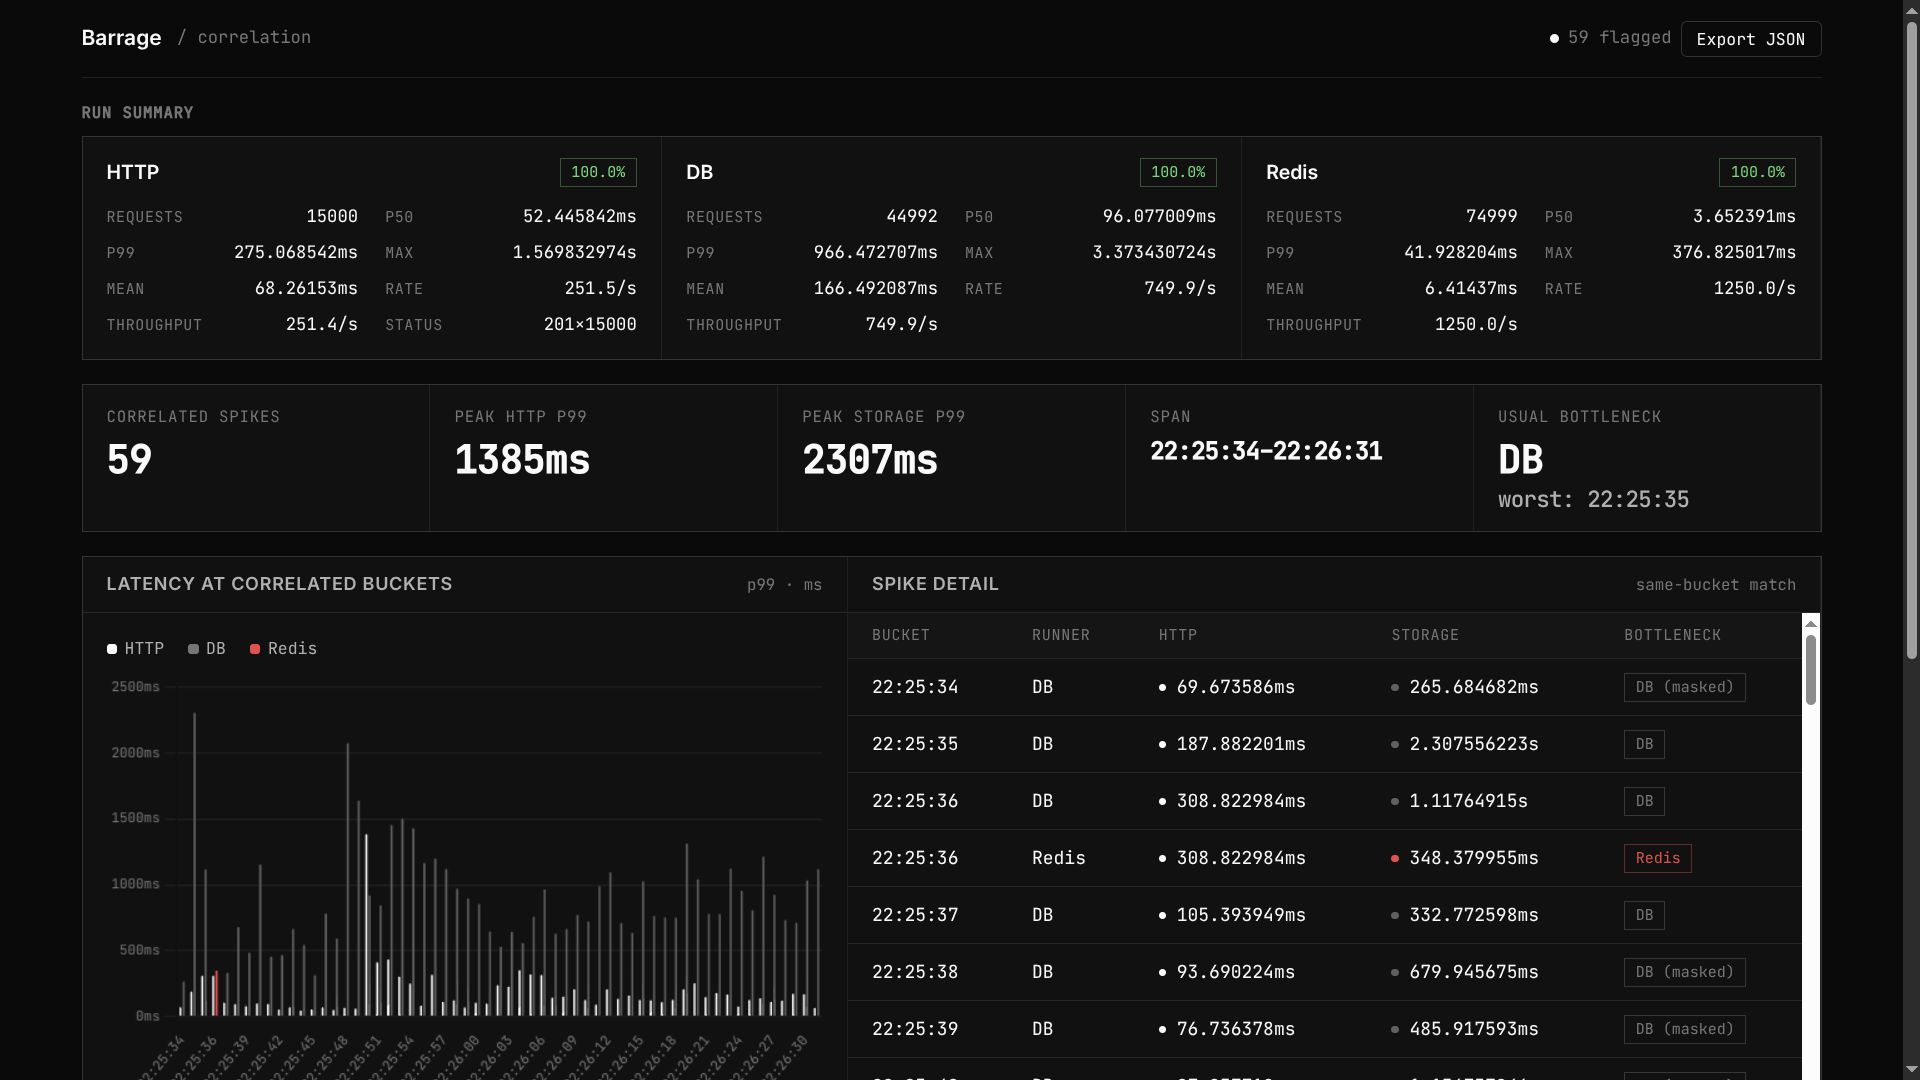
So I finally threw real traffic at it using Barrage, my own load testing tool that fires HTTP, DB, and Redis load together and shows you where things are actually slowing down. Here's what happened, including the two times I was completely wrong about why.
Run one: everything fell over
At around 750 DB ops/sec, about 10% of writes just started failing. Not slow, failed. My gut reaction: Postgres can't take it.
Checked the actual Postgres logs instead of trusting my gut. The errors weren't timeouts or lock contention, they were sorry, too many clients already. 4,482 times.
Turns out Kyu's connection pool plus my load test's own pool were asking for around 250 connections at once, and Postgres was capped at 100 by default. Kyu wasn't broken. I just never checked the limit before hammering it.
Lesson one: if a load test looks like the system is dying, check your own setup before you go bug-hunting inside the thing you built.
Run two: now it's worse
Bumped the connection limit, reran the same load. Zero connection errors this time. And the latency got worse — 1.3s up to 3s.
Which was actually good news. It meant the noise was gone and I was finally looking at something real, instead of a config mistake wearing a Postgres costume.
The index that wasn't helping
Went digging in the jobs table to see what was actually indexed versus what the queries needed. Found a real gap, status had no usable index, and the dashboard filters on status constantly. So I added one and ran EXPLAIN ANALYZE to check the improvement.
Barely moved. Dug into why and found the load test itself had inflated the table until 96% of rows were pending or dead. An index doesn't help much when almost every row has the same value, Postgres has to scan most of the table regardless. That was an artifact of my own test data, not a real finding about Kyu.
Then I noticed something more embarrassing: the dashboard queries that index was supposed to speed up don't even run under load. They only fire when the dashboard page loads or pushes an update. They weren't part of the 750 ops/sec I was generating at all. I'd spent effort optimizing a path that wasn't even in the test.
The actual hot path, insert, claim, complete, is 100% writes, all keyed on the primary key. Nothing in it needed that index in the first place.
Dropping it
Every job in Kyu gets three guaranteed writes and zero guaranteed reads unless someone's actively watching the dashboard. An index that isn't earning its keep on reads is just extra weight on every single write.
So I dropped it, cleared out the leftover data from earlier runs, and reran the exact same test.
The result
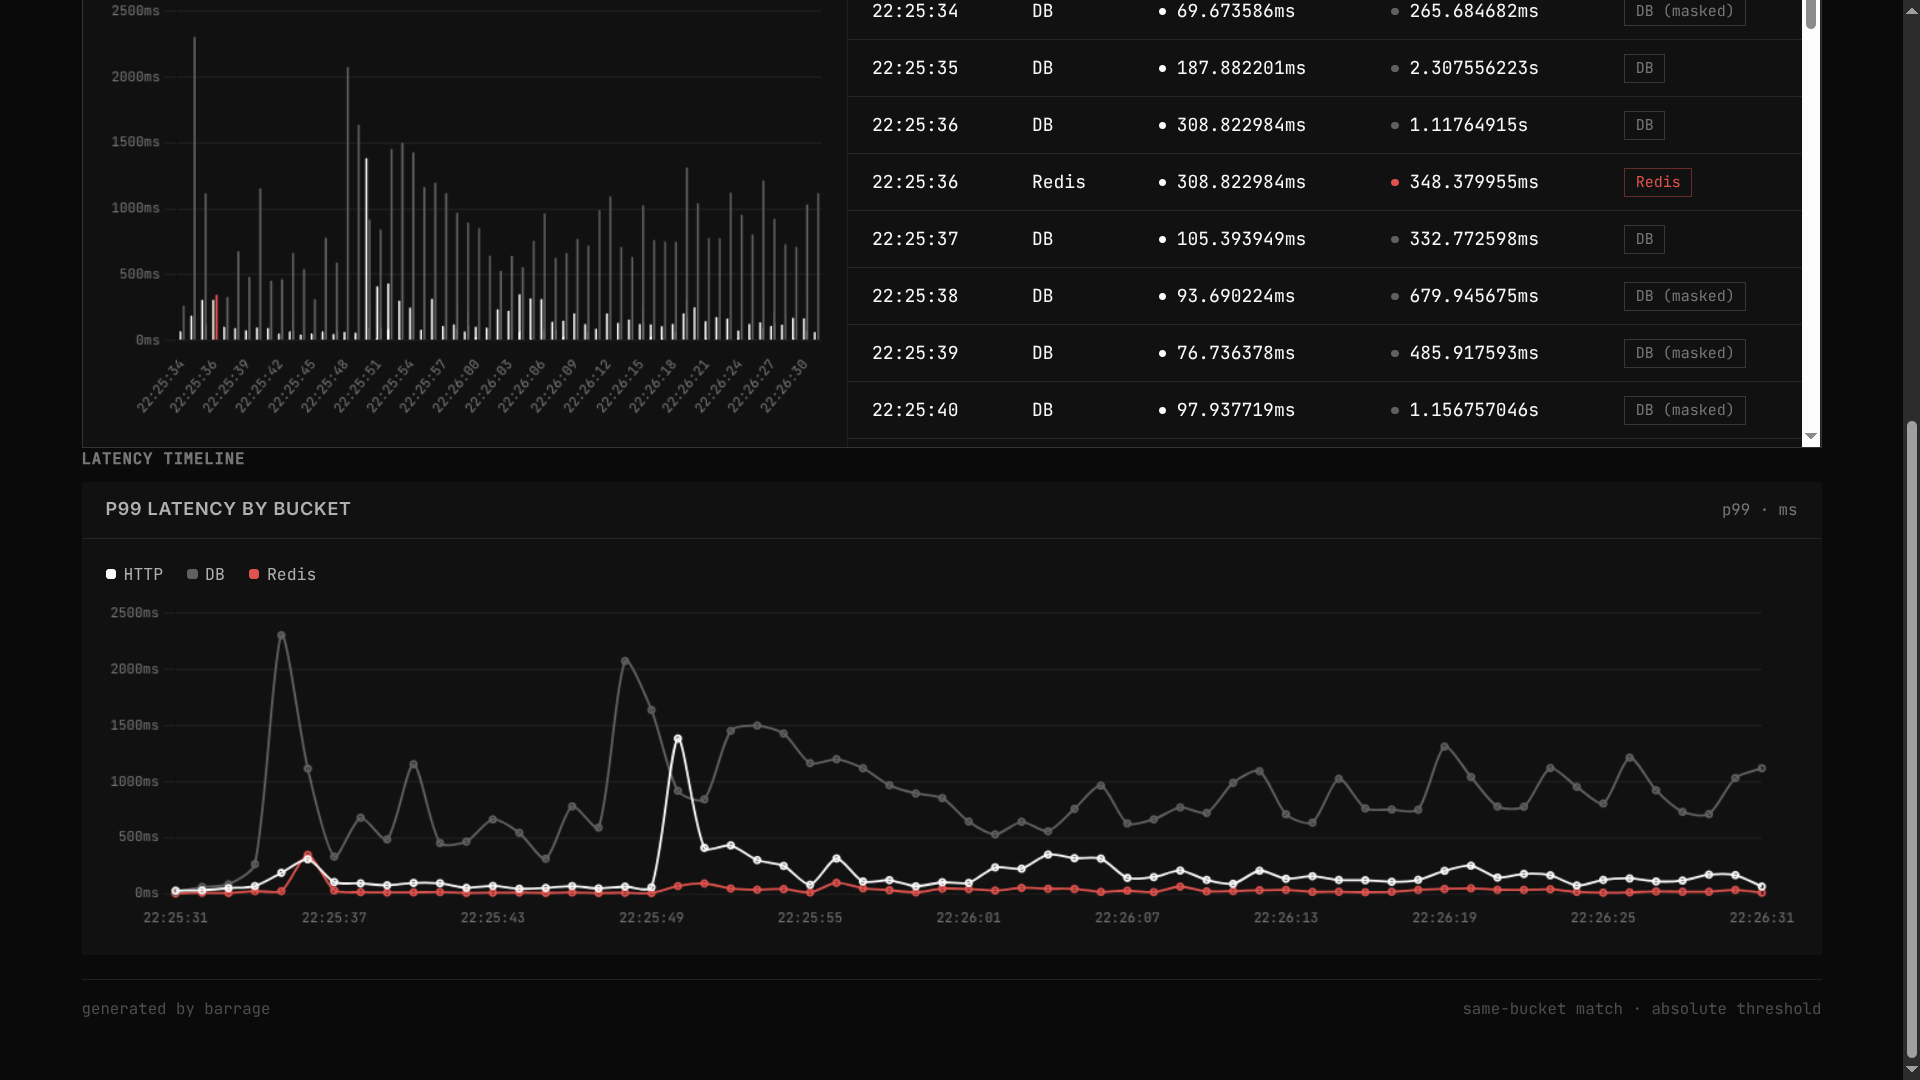
DB p99 went from 2999ms to 966ms. Mean latency went from 431ms to 166ms. Same load, same connections, same everything else, just minus one index.
Roughly a 3x speedup from removing something I'd added myself with good intentions and never actually tested under pressure. That's the part I keep thinking about, the biggest slowdown in this whole thing was my own fix.
Final numbers
~750 writes per second, sustained. 100% success. Zero jobs lost. All on one regular, untuned Postgres instance.
Redis, meanwhile, never even noticed any of this was happening, staying under ~70ms the entire time, even while Postgres was struggling. Exactly what the design was supposed to do.
Shoutout
Someone in the community, HalxDocs, shipped a compare view for Barrage runs the same day I was doing all this. Being able to look at two runs side by side made dropping the index feel a lot less like a gamble. Good timing.
Being honest about the ceiling
This is Kyu's limit on one plain Postgres box, no tuning, no extra tricks. There's probably more room past this number, I just didn't test it, so I'm not going to pretend I did.
Full data's in the benchmarks folder if you want to see it. Kyu's open source, go run your own numbers. Just check your connection pool first.